Lincoln International’s Electronics Group released its 2009 Q2 Electronics Manufacturing Services (EMS) Stock Index report. The report draws attention to:
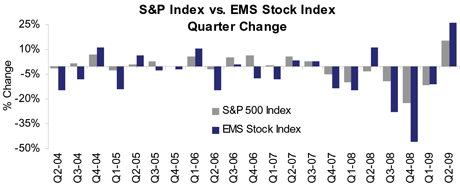
- Quarterly performance of the EMS Stock Index versus the S&P Index
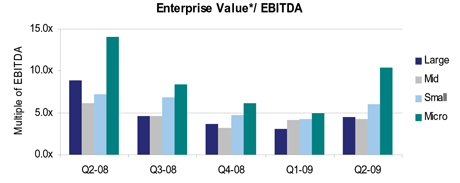
- Relative market valuations of each EMS Tier
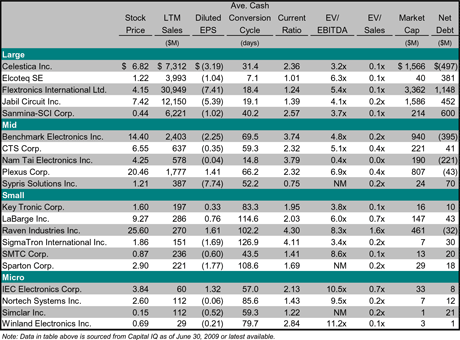
- Current financial data for each company in the index
Information for EMS companies and relative EMS stock value performance in the firm’s EMS universe study is based on sales dollar figures, by tier, as follows:
- Large (Tier I)…Greater than $3 billion
- Mid (Tier II)…$300 million to $3 billion
- Small (Tier III)…$150 million to $300 million
- Micro (Tier IV)…Below $150 million
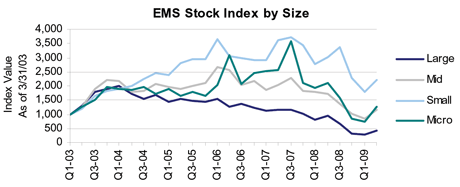
For each tier, the current period’s total market cap is calculated, divided by the base period’s total market cap and then multiplied by the base index (1000). The result is the plotting of the index value as shown below.

Looking at the EMS Stock Index by Size graph, above, highlights include:
- Large Index has increased 49.2% from Q109
- Mid Index has increased 38.0% from Q109
- Small Index has increased 23.7% from Q109
- Micro Index has increased 69.5% from last quarter
Similar to the S&P 500 Index, the EMS Stock Index is a market cap weighted composite index. The index is prepared by selecting a base period, in this case, Q1 2003, and totaling the market caps of the companies for each tier in this period.

Looking at EMS companies by tier, based on quarter-over-quarter share price performance, winners and losers can be identified:
| Winner’s Circle | Tier | |
| Celestica | 92% | I |
| CTS Corp. | 81% | II |
| SMTC Corp. | 112% | III |
| IEC Electronics Corp. | 184% | IV |
| Worst Performers | ||
| Elcoteq SE | 3% | I |
| Nam Tai Electronics | 14% | II |
| LaBarge, Inc. | 11% | III |
| Nortech Systems | (25%) | IV |
From a valuations perspective (compared to Q109) multiples were evaluated across all four tiers with findings as follows:
- Multiples for Large tier EMS companies increased due to an increase in equity values and lower EBITDA results.
- Mid tier EMS company multiples increased due to lower EBITDA and higher equity values.
- Small tier EMS company multiples increased due to higher equity values and lower EBITDA.
- Multiples for Micro tier EMS companies increased due to higher equity values.
* Enterprise Value is calculated as Market Cap on June 30, 2009 plus debt, preferred equity and minority interest less cash

Electronics manufacturing services (EMS) stock index data follows:

Source: Lincoln International Electronics Group, VentureOutsource.com July 2009
Get list of EMS manufacturers for your requirements (Its free)
Save time and money. Find quality EMS manufacturers. Fast. Venture Outsource has a massive, global database of contract electronic design and manufacturing capabilities. Speak with a Provider Advisor.
“Was able to very quickly find details on the important elements of setting up EMS and ODM partnerships, talked with an advisor for personalized info on quality providers matching our requirements while getting up to speed quickly about the industry and connect with key staff from like-minded companies and potential partners. Great resource.”
— Jeff Treuhaft, Sr. Vice President, Fusion-IO
Advisors tell you matches we find for your needs, answer your questions and, can share EMS industry knowledge specific to your industries and markets.


