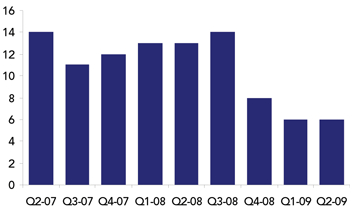
Overall, the economic conditions have heavily affected merger and acquisition activity within the electronics manufacturing services (EMS) sector. There were six completed transactions during the second quarter of 2009 in the EMS industry.
According to merger and acquisition guidance firm Lincoln International and as presented in the display in Figure 1, the six transactions show a steep decline in the M&A trend in EMS compared to Q2 2008.
Figure 1: Completed EMS transactions
As shown in Figure 2, vertical / horizontal convergences represented four transactions, or 67% of total activity in Q2 2009, up from two transactions in Q1 2009. There was one OEM divestiture in Q2 2009 up from no transactions in Q1 2009.
Figure 2: EMS merger and acquisition deal type – Quarter comparison
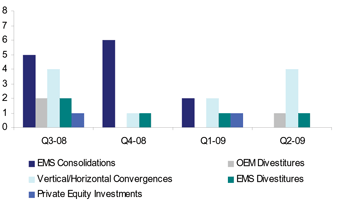
Accordingly, as a percentage of total transactions, OEM divestitures represented 17% in Q2 2009. The number of EMS divestitures remained stable with one transaction in both Q2 2009 and Q1 2009. There were no transactions classified as private equity investment in Q2 2009, one less than the previous quarter. There were also no transactions classified as EMS consolidation in Q2 2009.
As illustrated in Figure 3, three transactions occurred within Europe in Q2 2009, representing 50% of total transactions. This represents a decrease from the four transactions in the previous quarter. There were two cross-border deals; up from one in Q1 2009.
Figure 3: EMS merger and acquisition by geography – Quarter comparison
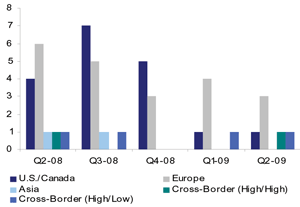
Note: “High / High” indicates cross-border transactions between Japan, Taiwan, Western Europe and U.S. / Canada; “High / Low” indicates cross-border transactions between high-cost regions and low-cost regions.
One transaction was between high and low cost geographies while the other was between two high cost regions. There was also one transaction within U.S. / Canada, or 17% of transactions, the same as during Q1 2009 within that geography. There were no transactions within Asia for this quarter.
As shown in Figure 4, transactions by size for the quarter were led by the Micro Tier, totaling four, or 67%, of all transactions. There was one transaction each (approximately 17% of total transactions) in the Small and Large Tier. Due to the economic market conditions, larger transactions were more difficult to complete in the past few quarters.
Figure 4: 2009 Q2 mergers and acquisitions by size
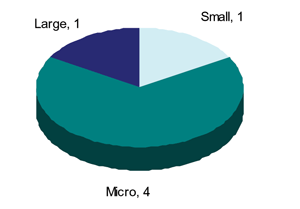
EMS size guide
- Tier 1 (Large): Greater than $3 billion
- Tier 2 (Mid): $300 million to $3 billion
- Tier 3 (Small): $150 million to $300 million
- Tier 4 (Micro): <$150 million
Margin performance
With the current economic conditions affecting the EMS industry, margins are down across all four groups. In order to increase margins, EMS companies are continuing to restructure operations, reduce capacity, and seek to more efficiently utilize assets.
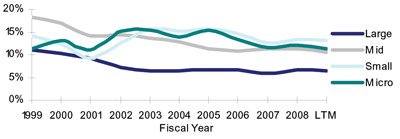
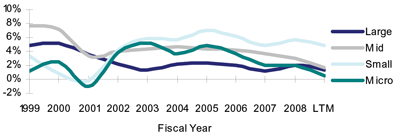
The three graphs below provide a summary overview of gross margin, operating income margin, and EBITDA margin performance from 1999 through today. Each graph shows the margin performance by size group.
Graph 1: EMS average gross margin performance
Graph 2: EMS average operating income margin performance
Graph 3: EMS average EBITDA margin performance
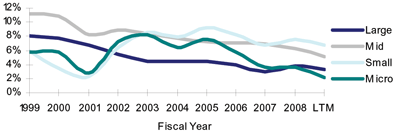
In terms of margin performance, every group showed worsening performance from fiscal year (FY) 2008 to Q2 2009 LTM (last twelve months) in gross margin, operating margin, and EBITDA margin.
In comparison, all groups except the mid group improved gross margins, operating margins, and EBITDA margins from FY 2007 to FY 2008.
On a relative basis, the Micro Group had the lowest LTM operating and EBITDA margins of all the groups due to its lack of scale. The Small Group had the highest LTM margins of the four tiers in gross margin, operating margin, and EBITDA margin due to its higher mix / low volume business model.
The Large Group’s gross margin was the lowest of all groups because of its high volume / low mix business model. The Mid group had the second highest operating income and EBITDA margins.
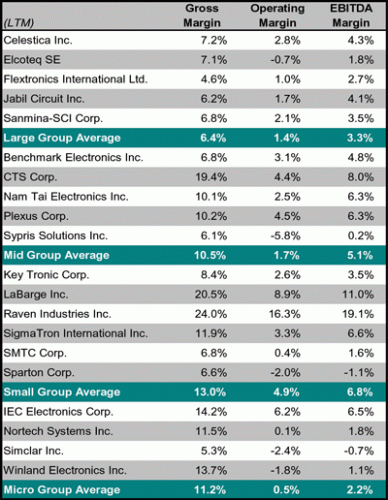
On a percent change comparing the Q2 2009 results with the same period a year ago, Celestica Inc. showed the most improvement in operating margin from 2.3% to 2.8% in the Large Group.
Benchmark Electronics Inc. led the Mid Group with stable operating margins at 3.1%; Key Tronic Corp. led the Small Group improving operating margins from 2.4% to 2.6%; and in the Micro Group, IEC Electronics Corp. improved operating margins from 3.2% to 6.2%.
Sources: Lincoln International which obtained its findings from internal data and company websites, Custer Reports, Manufacturing Market Insider and Capital IQ with VentureOutsource.com, August 2009
Get list of EMS manufacturers for your requirements (Its free)
Save time and money. Find quality EMS manufacturers. Fast. Venture Outsource has a massive, global database of contract electronic design and manufacturing capabilities. Speak with a Provider Advisor.
“Was able to very quickly find details on the important elements of setting up EMS and ODM partnerships, talked with an advisor for personalized info on quality providers matching our requirements while getting up to speed quickly about the industry and connect with key staff from like-minded companies and potential partners. Great resource.”
— Jeff Treuhaft, Sr. Vice President, Fusion-IO
Advisors tell you matches we find for your needs, answer your questions and, can share EMS industry knowledge specific to your industries and markets.


