China had highest rate of labor force participation for persons ages 25 to 54. U.S. remains leading producer of manufactured goods. Largest labor force was combined EU-15 countries. Sweden had highest social insurance costs as a percent of manufacturing hourly compensation. Republic of Korea had largest increase in manufacturing labor productivity. Spain, Portugal only European countries with lower hourly manufacturing compensation costs than U.S.
Trends in the global manufacturing labor force, hourly manufacturing compensation costs, manufacturing labor productivity and unit labor costs are all useful for partially assessing international competitiveness for companies with manufacturing and labor at the core of their product or services. (See, also: Report: China manufacturing hourly labor rate, compensation costs impact EMS)
Information presented in this article represents related manufacturing and labor data VentureOutsource.com believes is of interest to our decision-making users.
The data that follows is part of a report released by the U.S. Bureau of Labor Statistic (www.bls.gov) and is based mainly upon the output of the BLS program of international comparisons of labor force, compensation, prices, and productivity.
To increase country and indicator coverage, BLS data are supplemented by data from the Organization for Economic Cooperation and Development (www.oecd.org) and other organizations. Due to the nature of data presented and the amount of time required to ensure data is as accurate as possible, readers will note the amount of time data timeframes precede the April 2010 release date of this report. Visit the BLS website for report methodology and additional information.
Size of the labor force, 2008 [Fig.1]
The labor force is comprised of all employed and unemployed persons, that is, all members of the working-age population who are either (1) working for pay, profit, or family gain, or (2) available for and actively seeking work. The labor force represents the supply of labor in an economy. The size of the labor force is affected by the size of the country’s population.
The EU-15 countries combined had the largest labor force, followed by the United States.
Fig. 1

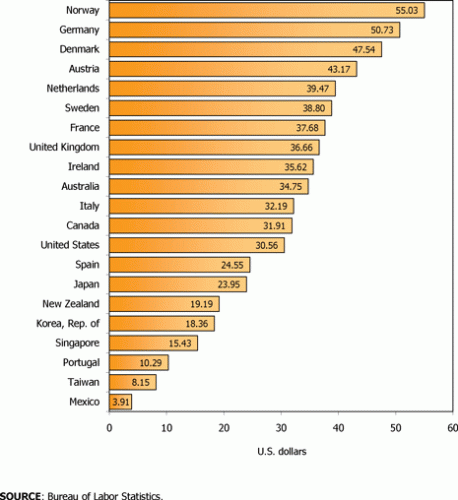
Hourly compensation costs, 2007 [Fig. 2]
Hourly compensation costs measure the cost to employers to hire one hour of labor in manufacturing. They include payments made directly to workers, as well as employer expenditures on social insurance.
In some countries, taxes and subsidies related to employment also are included. For this measure, hourly compensation costs in national currencies have been converted to U.S. dollars using market exchange rates.
Manufacturing hourly compensation costs were highest in Norway, at 1.8 times the U.S. level. Australia, Canada, and 10 of the 12 European countries had higher hourly compensation costs than the United States. Spain and Portugal were the only two European countries that had lower hourly compensation costs than the United States. Hourly compensation costs were under $11 in Mexico, Taiwan, and Portugal.
Fig. 2

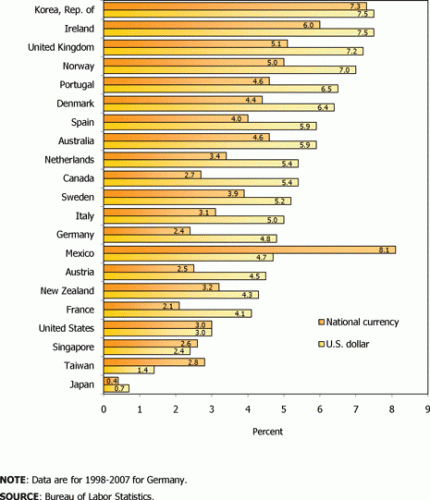
Average annual growth rates for hourly compensation costs, 1997 to 2007
(All employees in manufacturing) [Fig. 3]
Hourly compensation costs can be measured in the national currency of each country or converted to U.S. dollars using exchange rates. When national currencies are converted to U.S. dollars, growth in hourly compensation is magnified if the foreign currency appreciated against the dollar, or lessened if the foreign currency depreciated. The differences between the two growth rates represent the effects of changes in exchange rates.
During this period (1997 to 2007), the national currency of every country, except Mexico, Singapore, and Taiwan, appreciated against the U.S. dollar; therefore, growth in manufacturing hourly compensation costs was greater in U.S. dollars than in national currencies for all but these three countries. Growth in U.S. hourly compensation costs was relatively low.
Fig. 3

Employer social insurance expenditures and other labor taxes as a percent of hourly compensation costs, 2007 (All employees in manufacturing) [Fig. 4]
Social insurance expenditures refer to the value of contributions made by employers to secure employee entitlement to benefits such as, for example, retirement and disability pensions, health insurance, occupational injury and illness compensation, unemployment insurance, or life insurance; these contributions often provide delayed future income and benefits to employees. Other labor taxes refer to taxes on payrolls or employment (or reductions to reflect subsidies).
Social insurance costs as a percent of manufacturing hourly compensation costs ranged widely, from 12.3% (Denmark) to 33.1% (Sweden) in European countries, and from 4.6% (New Zealand) to 26.3% (Mexico) in non-European countries.
Fig. 4

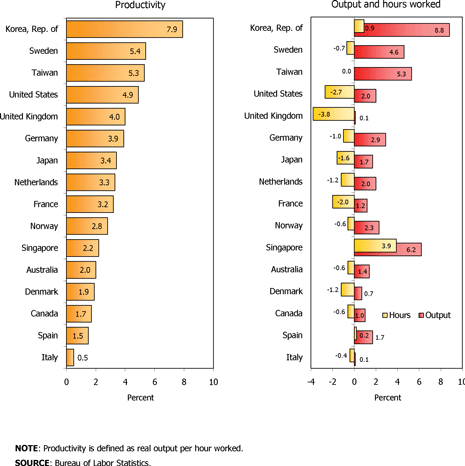
Average annual growth rates for manufacturing productivity, output, and hours worked, 1998 to 2008 [Fig. 5]
Manufacturing labor productivity is a measure of economic efficiency that shows how effectively hours worked are converted into output. When output growth is larger than growth in hours worked, productivity increases; conversely, when growth in hours worked is larger than output growth, productivity decreases. Advances in productivity can increase national income.
In all countries, manufacturing output growth was larger than growth in hours worked, indicating increasing productivity; specifically, as output increased, hours worked decreased in all but four countries. The Republic of Korea had the largest increase in manufacturing labor productivity, followed by Sweden, Taiwan, and the United States; growth was lowest in Italy.
Fig. 5

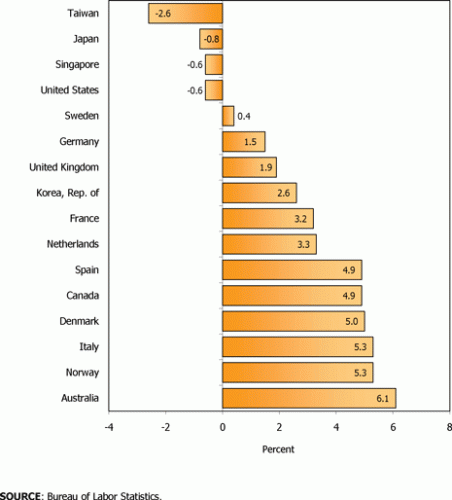
Average annual growth rates for manufacturing unit labor costs in U.S. dollars, 1998 to 2008 [Fig. 6]
Unit labor costs are calculated by dividing hourly compensation (compensation per hour) by productivity (output per hour). This indicator, therefore, measures the cost of labor compensation expended to produce one unit of output. Unit labor costs have a large impact on an economy’s international cost competitiveness; declines in unit labor costs indicate that an economy is becoming more cost competitive.
Manufacturing unit labor costs declined only in Taiwan, Japan, Singapore, and the United States. Australia had the largest increase in unit labor costs.
Fig. 6

Get list of EMS manufacturers for your requirements (Its free)
Save time and money. Find quality EMS manufacturers. Fast. Venture Outsource has a massive, global database of contract electronic design and manufacturing capabilities. Speak with a Provider Advisor.
“Was able to very quickly find details on the important elements of setting up EMS and ODM partnerships, talked with an advisor for personalized info on quality providers matching our requirements while getting up to speed quickly about the industry and connect with key staff from like-minded companies and potential partners. Great resource.”
— Jeff Treuhaft, Sr. Vice President, Fusion-IO
Advisors tell you matches we find for your needs, answer your questions and, can share EMS industry knowledge specific to your industries and markets.


